The detail
How it works.
Everything behind the survey: how a job runs, what lands in your hands, how it compares with sending a team out on foot, and where we fly. The short version is on the home page.
How a job runs
Flight plan to hosting.
The same sequence whether it's a half-hour shoot or a multi-hectare survey — and it does not stop at handover.
Brief & site check
We confirm the deliverable you need, the site, and any access or scheduling constraints.
Flight plan & airspace clearance
Flight lines, altitude and overlap are planned and checked against NOTAMs and controlled airspace before we fly.
Capture
On-site flying to the plan — stills, video or mapping passes, weather window permitting.
Processing
Raw data is processed into the agreed output — graded footage, orthomosaic, point cloud or model.
Delivery
Completed datasets are delivered through our own online viewer — pan, measure and share your model straight from a browser, no specialist software needed — alongside the raw files in whichever format you work in.
Hosting
Your data stays live with us for twelve months, extended by arrangement. Nobody on your side buys a licence to open it and no one is charged a seat, so a report goes to a client, an insurer or a planning officer and simply opens. Most of the industry stops at step five and hands you a folder.
It is held in the UK and private from the moment it lands. A dataset is visible only to the people you name, access is granted and withdrawn on your instruction, and we will delete it outright whenever you ask. Your data is never sold, shared with anyone you have not named, or reused for any purpose of ours.
Output formats
Capabilities.
Every panel below is output from our own flights — not an illustration of what the formats look like.
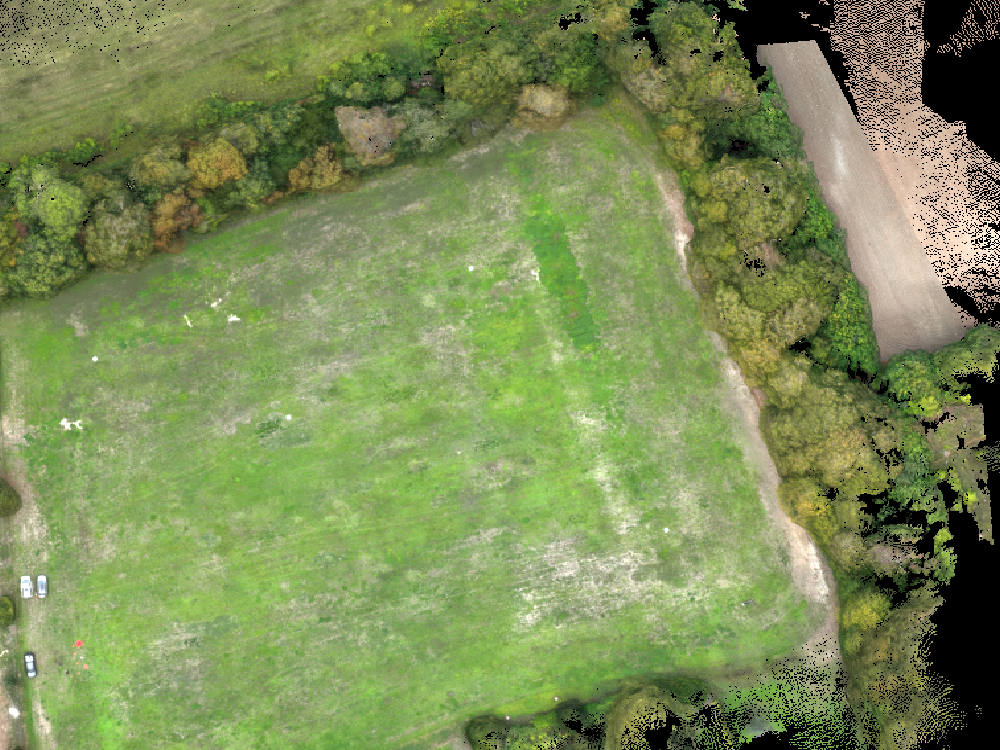
Orthomosaic Map
GSD ≈ 2–4 CM/PX · 70–80% OVERLAP
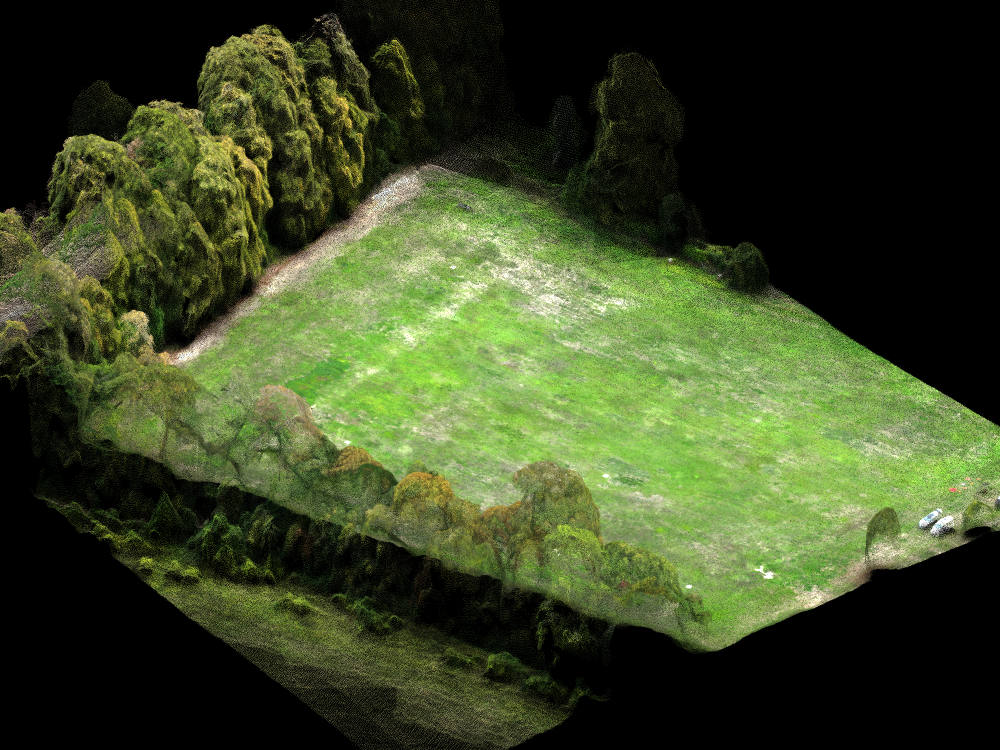
Point Cloud
STRUCTURE-FROM-MOTION · RGB-COLOURED
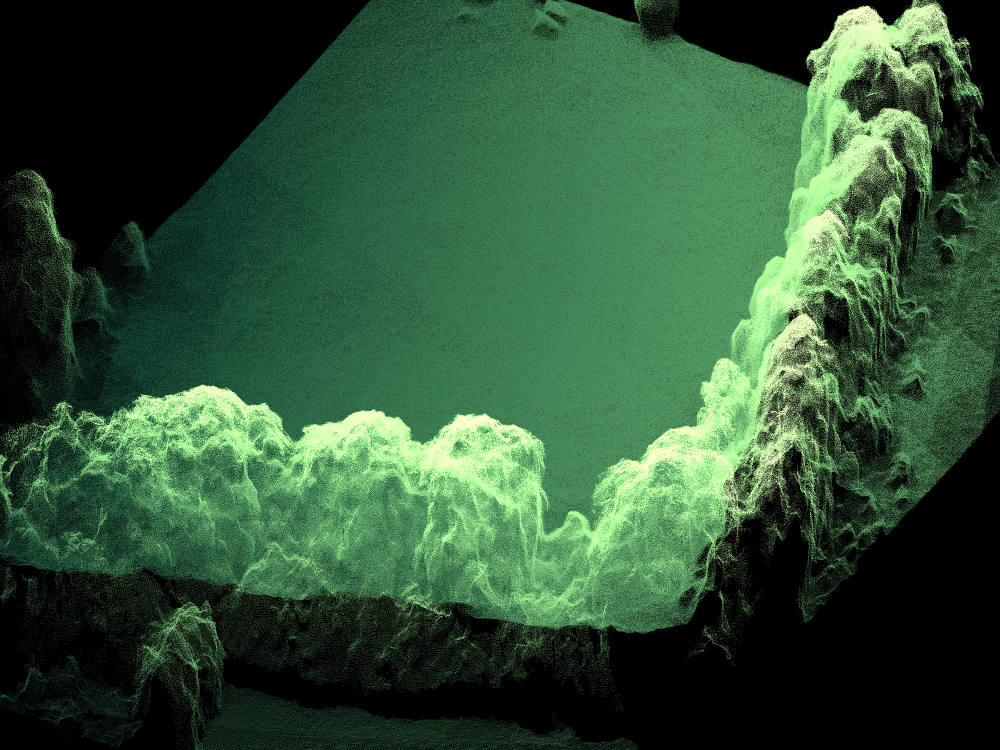
Elevation / Contour Model
DEM/DSM · CONTOUR INTERVAL 0.5M
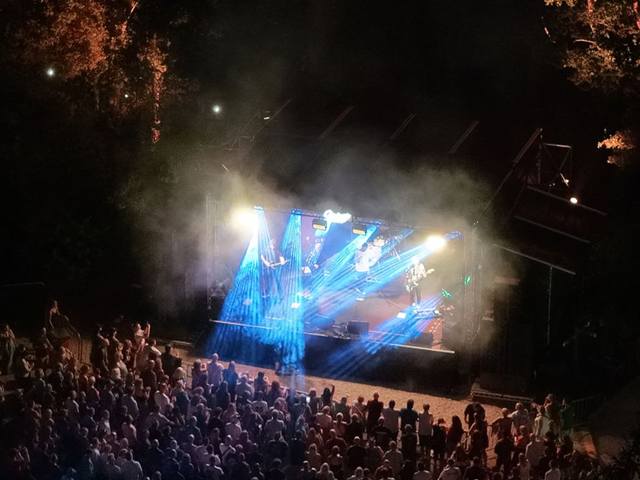
Aerial Photography & Video
4K VIDEO · RAW STILLS · GRADED DELIVERY
Why drone photogrammetry
Drone survey vs. traditional survey.
Where an aerial photogrammetric survey outperforms a conventional ground survey.
| Factor | Traditional ground survey | LAM drone photogrammetry |
|---|---|---|
| Time on site | Multiple visits, often days for larger sites | Single flight session, typically hours |
| Site access & safety | Personnel on foot across the whole site, including unstable ground, height or live plant areas | No one needs to physically access hazardous, unstable or restricted ground |
| Coverage | Discrete surveyed points and cross-sections | Continuous coverage — every square metre of the site captured |
| Repeat monitoring | A fresh visit, and cost, each time the site changes | Repeat flights overlay directly for progress and volumetric change over time |
| Data density | Individual survey points | Dense point clouds & true-colour orthomosaics — millions of points per hectare |
| Deliverables | 2D drawings, spot levels, written reports | Orthomosaic, point cloud, mesh, DEM/DTM & volumetric report |
| Equipment | Standard survey-grade instruments | DJI Matrice 4E with RTK & Emlid Reach RS4 base station |
| Accuracy | Survey-grade, dependent on method & equipment | Better than 60 mm horizontal, 44 mm RMS, measured against withheld check points — Emlid Reach RS4 ground control & RTK positioning ¹ |
| Cost driver | Scales with crew time and number of site visits | Scales with site size and deliverable complexity ² |
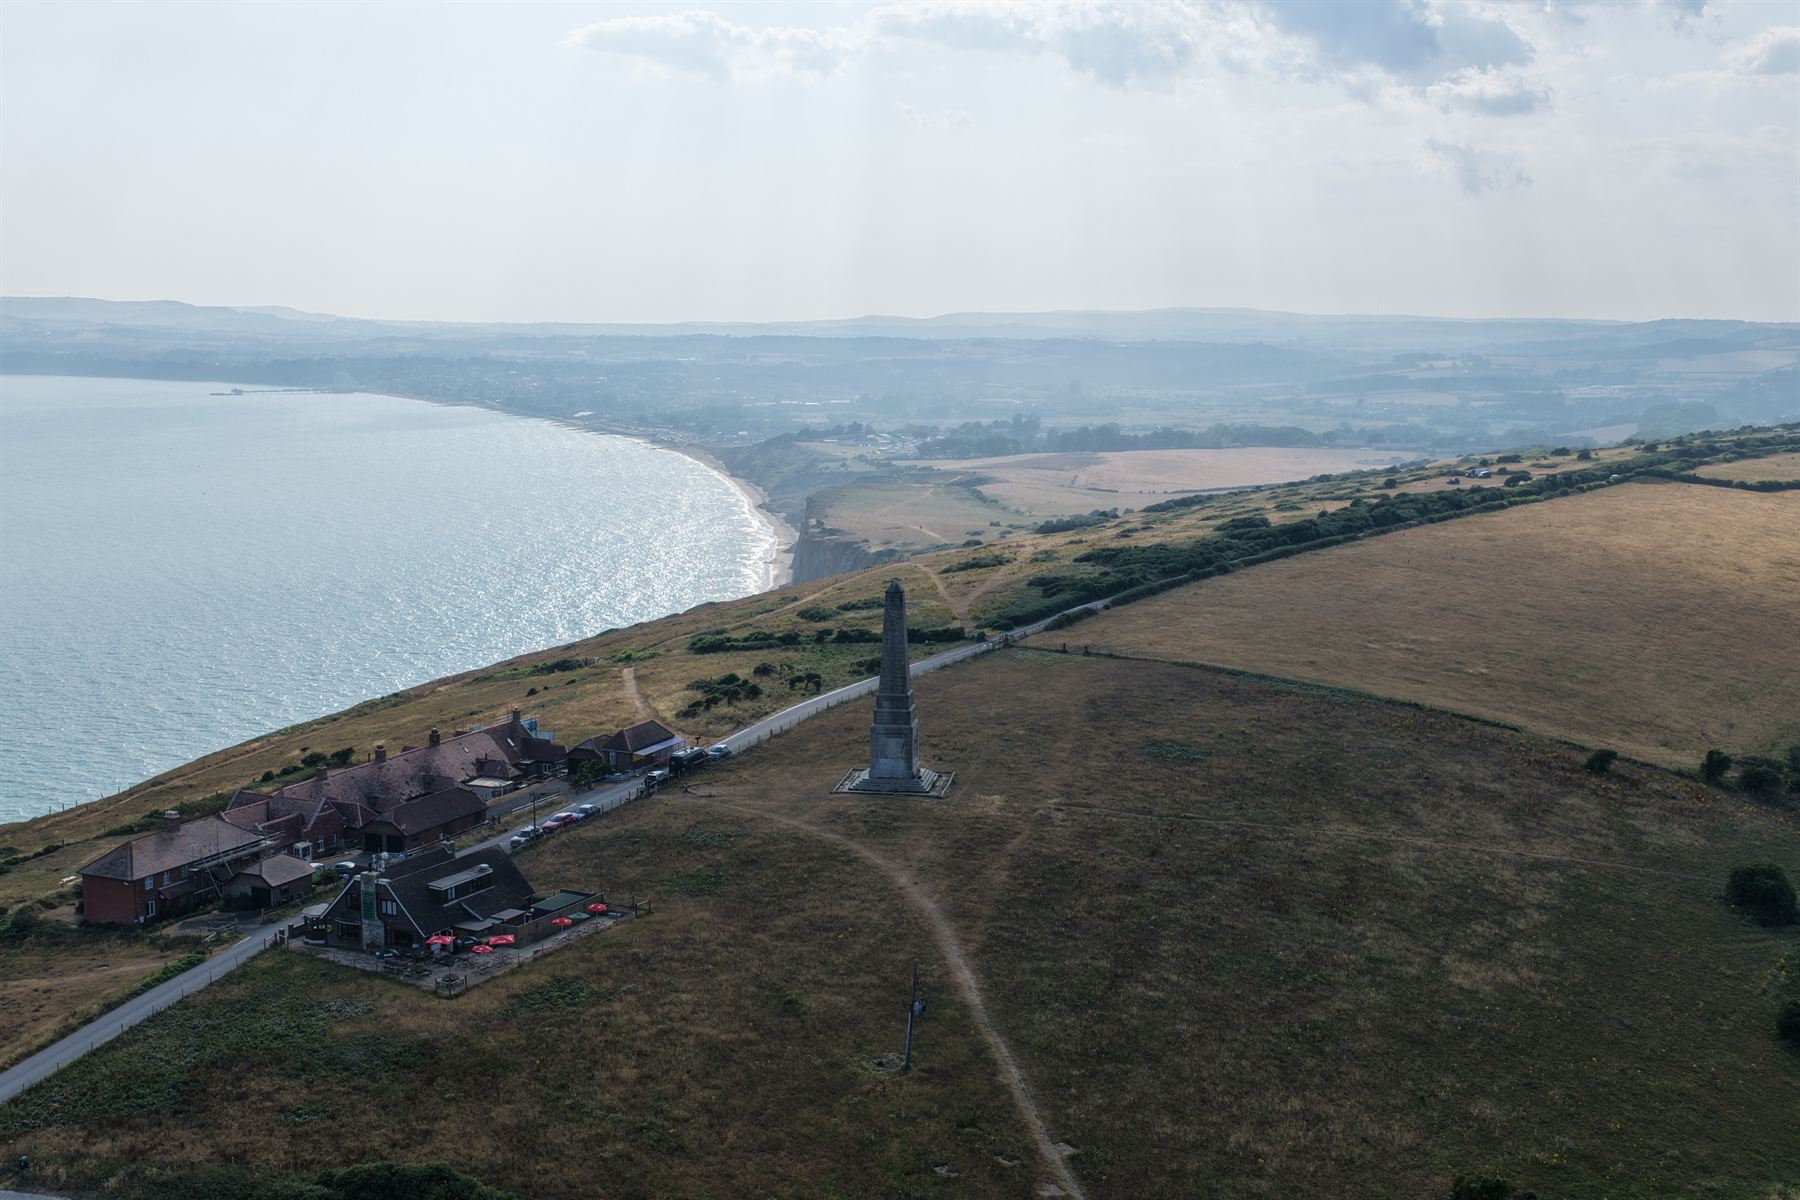
Where we operate
Isle of Wight, South Coast & National, by arrangement.
LAM Geospatial offers services on the Isle of Wight, across the South Coast, and nationally by arrangement — every South Coast site within same-day reach.
-
HOME BASE
Isle of WightNewport & the surrounding Island — our default operating area, and where we can move at short notice.
-
≤ 120 KM
South CoastHampshire, Dorset and West Sussex, including cross-Solent ferry crossings for site visits.
-
UK-WIDE
National, by arrangementMulti-day surveys and productions flown anywhere in the UK — get in touch to discuss logistics.
Questions
Frequently asked.
What clients usually want to know before booking a first flight.
¹How accurate is drone photogrammetry compared to a traditional survey?
Accuracy comes from ground control points, RTK positioning and flight design — not from the aircraft alone. On our own controlled test flight, horizontal accuracy measured better than 60 mm, with an RMS of 44 mm (what RMS means). That was assessed the honest way: five surveyed targets, each held out of the processing in turn, with the model's position for the withheld target compared against its surveyed coordinate. The method is written up in full and we will send it to anyone who asks.
Project accuracy is confirmed at quote stage, because it depends on the site, the flying height and how dense the control network needs to be — more targets and a lower flight both improve it. Vertical accuracy is agreed per project rather than published, since it is far more sensitive to control density than horizontal and we would rather quote it against your site than advertise a number we would have to qualify.
What does RMS mean, and why quote two numbers?
RMS stands for root mean square. It is the standard way a set of measurement errors is summarised as a single figure.
Accuracy is checked at surveyed targets held out of the processing, so the survey never saw them. Each one produces an error — the distance between where the survey placed that point and where it was independently measured to be. That gives a set of numbers, not one.
To summarise them, each error is squared, the squares are averaged, and the square root of that average is taken. Squaring makes larger errors count for more, so a single bad point raises the figure instead of being hidden behind good ones. That is why survey work uses RMS rather than a plain average: it cannot be flattered by cherry-picking.
So the two figures answer different questions. 44 mm RMS is the typical error across the check points, weighted against large misses, and is the number another surveyor will recognise and compare against their own. Better than 60 mm is the worst single point measured — a ceiling rather than an average, and usually the more useful figure when you are deciding whether a survey is fit for what you need it to do.
Both come from the same flight. The full write-up — how the targets were laid, how they were surveyed, and the residual left at each one — is yours on request.
²How is a project priced?
Every project is quoted as a fixed figure, scoped to the outcome rather than to hours on site. What shapes it is the size and complexity of the site, the deliverables you need, how much ground control the accuracy demands, and whether the work repeats over time for progress or stock monitoring.
What does not shape it is how long we happen to be standing in the field. A survey that takes twenty minutes to fly is worth what the figures are worth. Processing and twelve months of hosting are part of the work rather than billed afterwards, and nobody you forward the result to is asked to buy a seat to open it.
Tell us the site and what the output has to do, and you will have a fixed quote for the whole of it.
Can you fly near airports or in controlled airspace?
Often, yes. Our CAA PDRA01 authorisation permits closer operation near people and property than standard rules allow, and every job includes an airspace and NOTAM check beforehand. Some locations need additional permission from air traffic control, which we factor into the flight plan.
What happens if the weather is bad on the day?
Flights depend on safe wind, visibility and precipitation limits. If conditions aren't safe or compliant, we reschedule to the next suitable window.
What file formats will I receive?
Back the next working day on a typical site, larger jobs agreed up front. Typically topographic drawings (DWG/DXF), orthomosaics (GeoTIFF/JPEG), point clouds (LAS/LAZ), meshes (OBJ), elevation models (GeoTIFF/XYZ) and PDF reports — or graded video and RAW stills for photography work. Let us know if your workflow needs a specific format.
How do I access the finished survey?
Completed datasets are delivered through our own client portal. You open the model in a browser and work with it directly — pan it, measure distances and levels, take cross-sections, calculate volumes and share it with a link. There is no specialist GIS or CAD software required and nothing to install. The underlying files are supplied alongside it for your own workflows.
Does my team need to buy software to view it?
No. It opens in an ordinary web browser on a laptop, tablet or phone. There is no per-seat licence for your team, and no cost to whoever you forward it on to — a contractor, client, insurer or planning officer can open the same model you are looking at. This is worth checking when you compare quotes. It is common for survey data to be handed over on a third-party platform the client is then expected to subscribe to, seat by seat. We host your data ourselves as part of the work, and a report you send to a client, an insurer or a planning officer opens for them without an account.
How long do we keep access to the data?
The raw files are yours permanently from the day they are delivered — they sit on your systems, not ours, and nothing expires. The interactive model is hosted for you for twelve months after handover at no extra charge, and can be extended by arrangement or re-hosted later if you need it back. If you would rather hold everything in-house from the outset, we can deliver the files on their own.
Who can see our data, and how is it protected?
Your data is held in the United Kingdom, and Lane Aerial Media Ltd is registered with the Information Commissioner's Office as a data controller under reference ZC189317. A survey is private from the moment it is processed. It is not indexed, not public, and not visible to anyone but the people you name — access is granted on your instruction and withdrawn the same way. Ask us to delete a dataset and it goes.
We do not sell your data, share it with anyone you have not named, or reuse it for our own purposes. Nothing from a commercial project appears in our own marketing without your written agreement, which is why the examples on this site are not identified.
On personal data specifically: aerial imagery can capture people, vehicles and neighbouring property. We plan flights to capture what the job needs and no more, and where identifiable detail appears incidentally we will blur it on request before anything is shared onward. If your organisation needs a data processing agreement in place, ask and we will put one in front of you before the flight rather than after it.
The raw files are yours outright. If you would rather nothing sat with us at all, we can deliver the files and host nothing.
What happens if someone disputes a measurement?
Every figure in a report opens back to the measurement it came from, on the model, so it can be inspected rather than argued about. Where a volume, level or quantity sits between two parties — a contractor and a client, a progress claim, a material sale — both are looking at the same captured site rather than at two spreadsheets. Ground control points and independent check points are recorded as part of the job, so the basis for the figures is documented from the start.