Skip to content
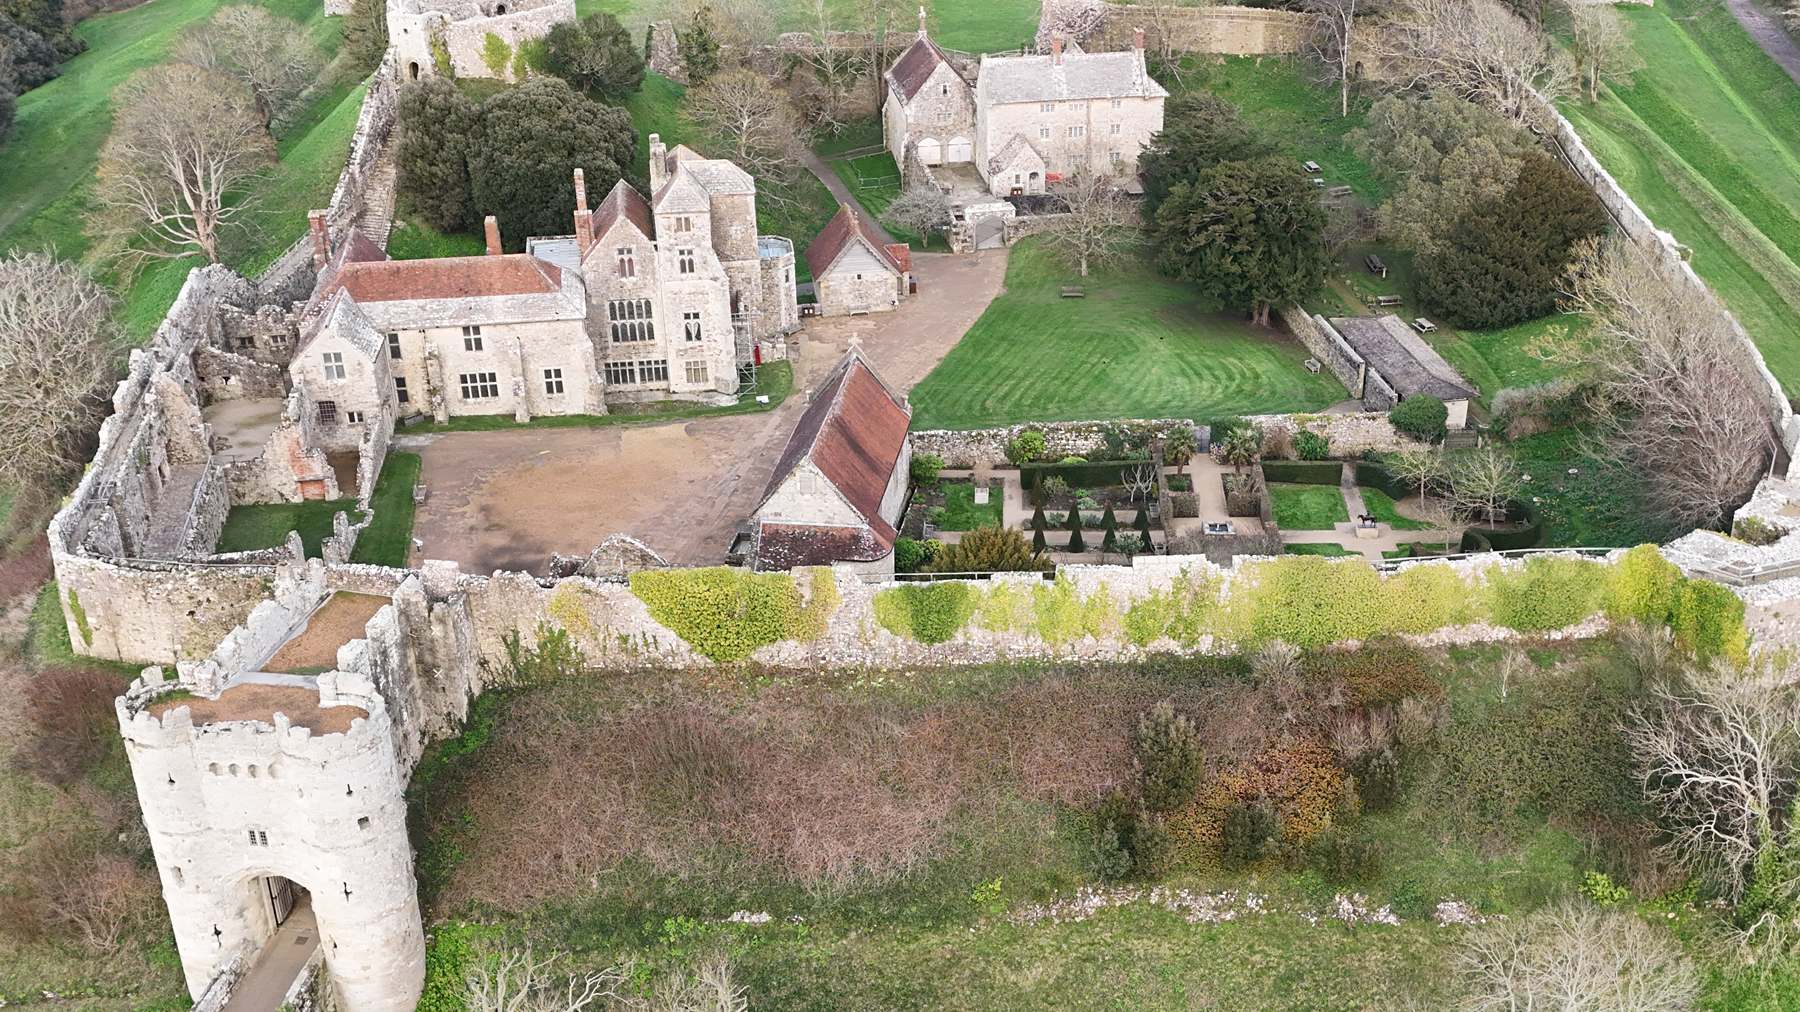
Carisbrooke Castle photographed from the air - the gatehouse, great hall, chapel, formal garden and curtain wall of the whole enclosure

Flagship service

Photogrammetry & 3D Modelling.

Overlapping aerial imagery, processed into survey-grade point clouds, meshes and volumetric reports — the core of what LAM Geospatial does.

  • Point clouds
  • Meshes
  • Digital twins
  • Volumetrics

700,000150,000 points from one of our own survey flights — real ground, measured rather than modelled.

Carisbrooke Castle — our own flight

See it before you buy it. Twenty minutes, in person or on a call — we open a live survey in the browser, show you what it produces, and then show you the ground control and accuracy behind our own flying. You judge the method, then decide whether it is worth paying for.

Book a demonstration

How it works

From overlap to model.

Photogrammetry rebuilds 3D geometry from ordinary photographs — and the accuracy comes as much from the method as the camera.

01

Capture

Overlapping stills flown in a grid pattern — typically 70–80% front and side overlap, altitude set to the ground sample distance the deliverable needs.

02

Match

Software finds shared features across thousands of overlapping frames and solves each camera's position — structure-from-motion.

03

Densify

Multi-view stereo fills in the detail between matched points, building a dense point cloud of the whole site.

04

Model

The point cloud becomes a mesh, orthomosaic, DEM/DTM or volumetric report — whichever format the job calls for.

Centimetre-accurate drone surveys are not automated outputs. They are the result of deliberate, mathematically defensible choices.

Your deliverable

What you receive.

A live, measurable model you open in a browser — with every underlying file supplied alongside it.

A model you can measure, not a folder you can't open.

Completed datasets are delivered through our own client portal. You open the survey in a browser — pan it, measure it, section it, share it — with nothing to install and no specialist GIS or CAD licence to buy. The raw files come with it for your own workflows.

If a figure is ever questioned, it opens back to the measurement it came from. Everyone is looking at the same site.

  • Measure anything on screen Distances, heights, areas and cross-sections taken straight off the model.
  • Volumes you can stand behind Draw around a stockpile for cubic metres and tonnage — with the working shown.
  • Compare one survey against the next Period-to-period change, or measured against a design surface.
  • Share it with a link Your team, your client, your insurer. No software for them to buy.
  • Hosted for twelve months, extended by arrangement Included in the project price, not billed to you as a yearly licence.

Output formats

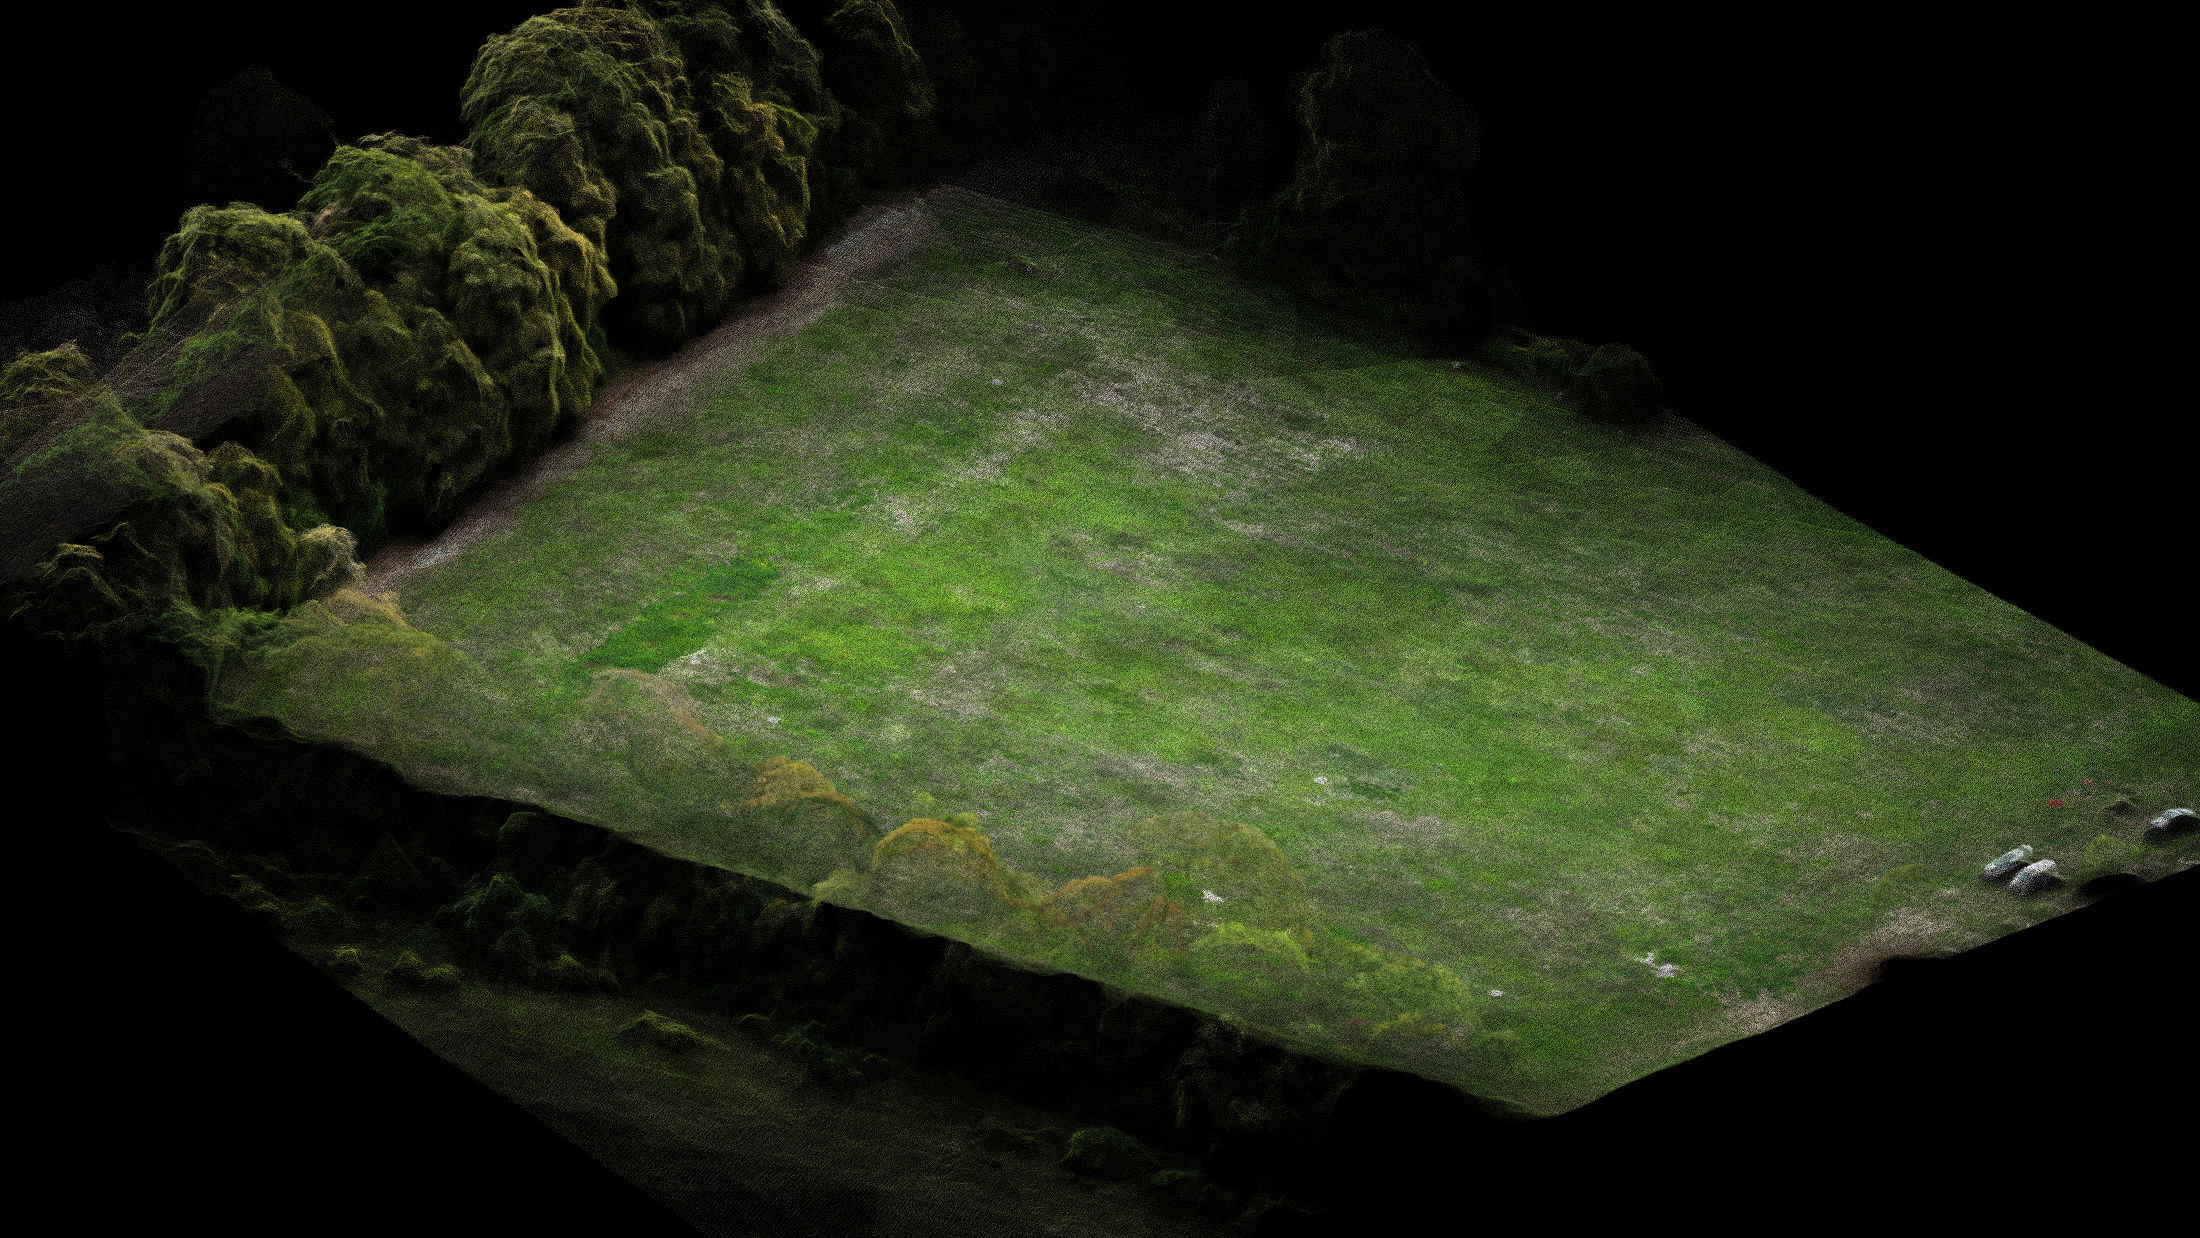
Point cloud of surveyed ground, the field surface and its boundaries resolved as measured height

Point Cloud

STRUCTURE-FROM-MOTION · RGB-COLOURED

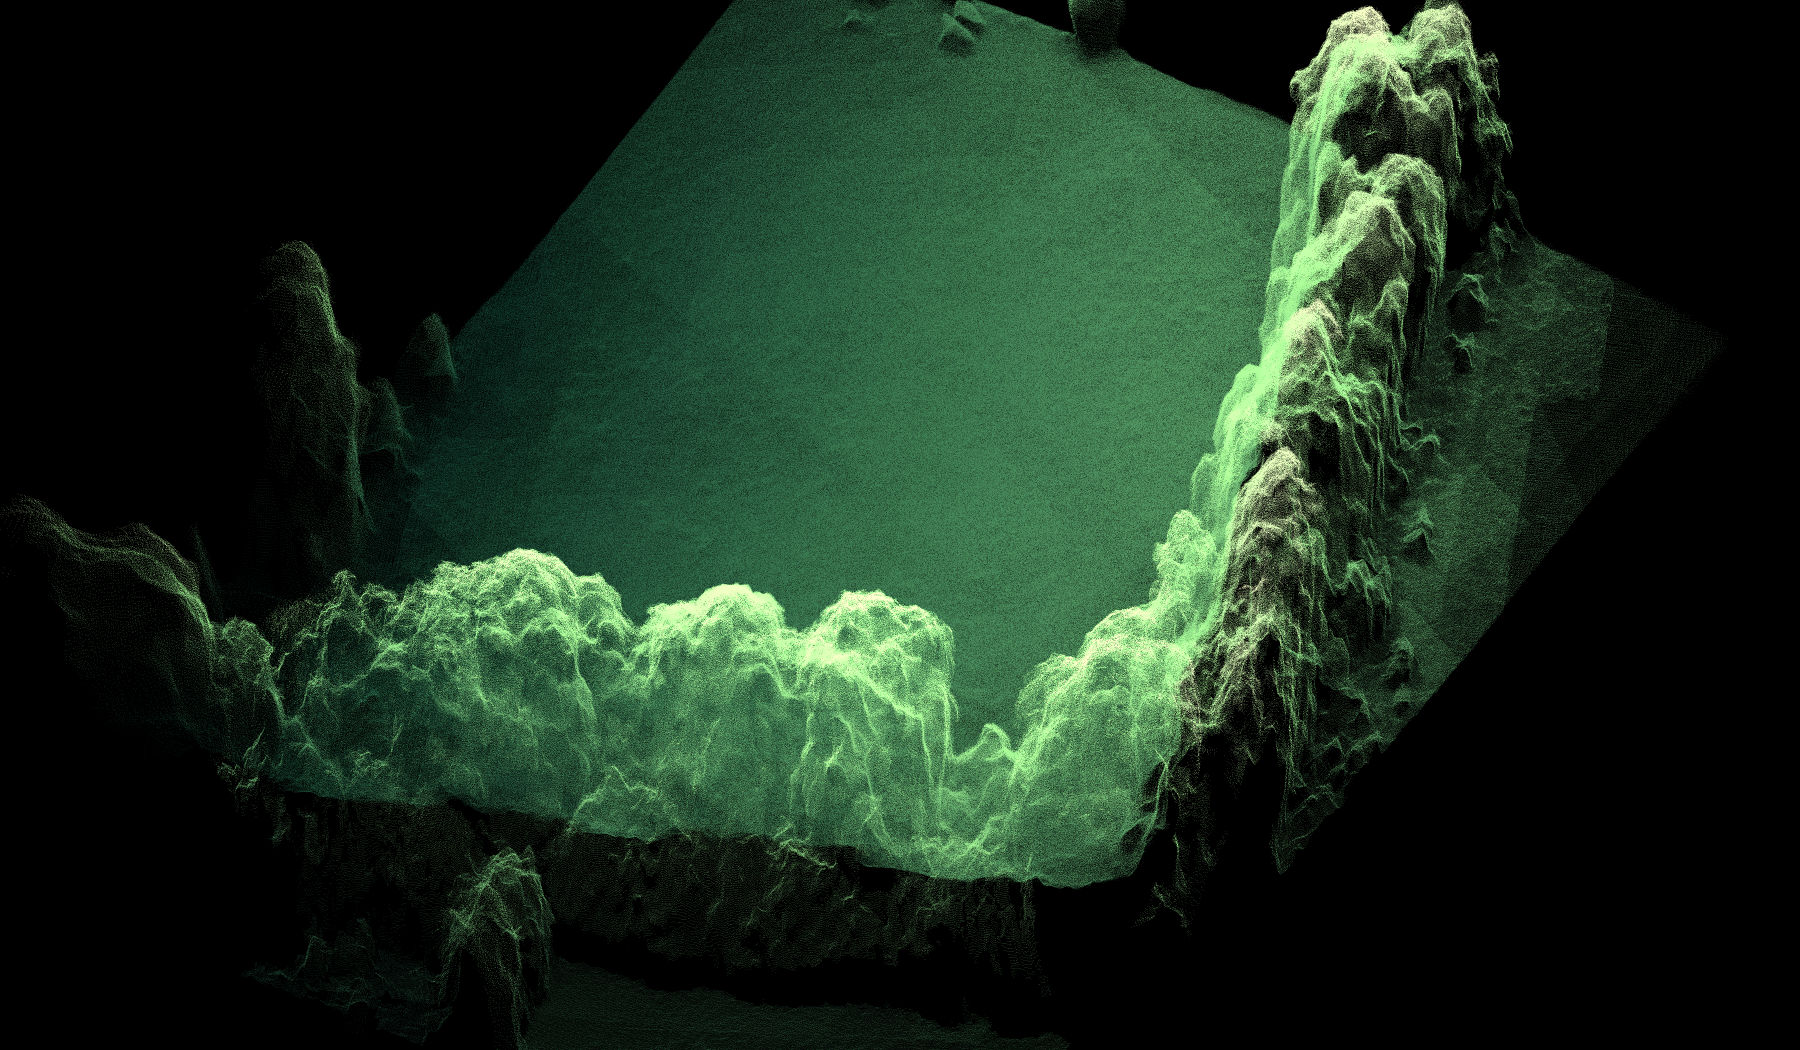
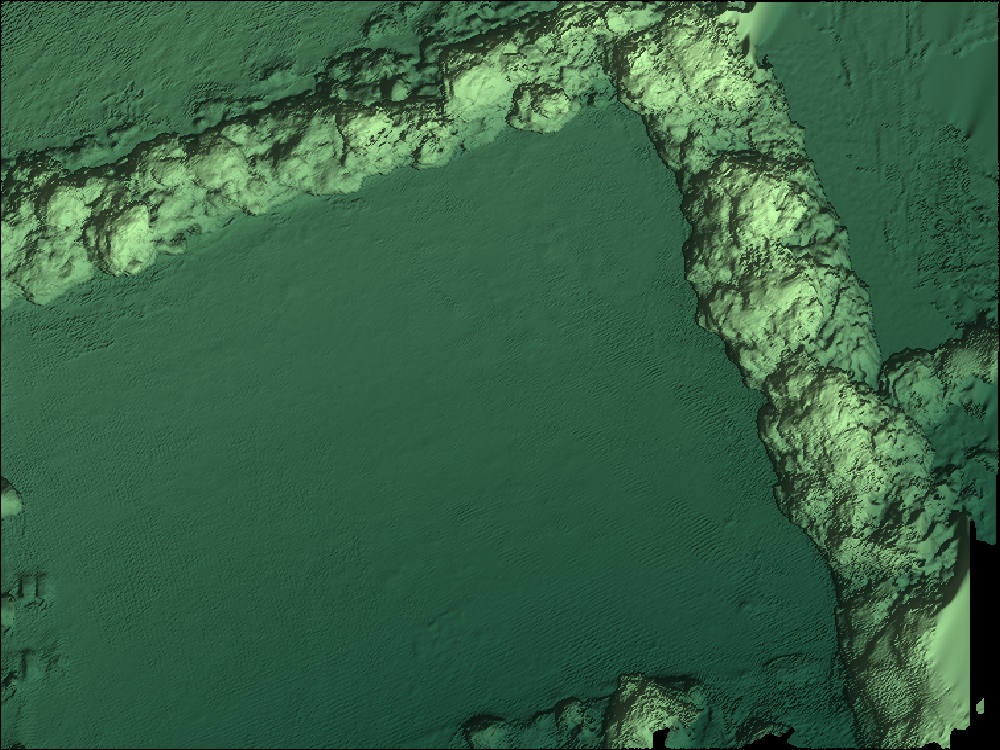
Triangulated surface mesh built from our own survey data, the field surface carried as continuous geometry

Mesh Model

TRIANGULATED SURFACE · OBJ/PLY

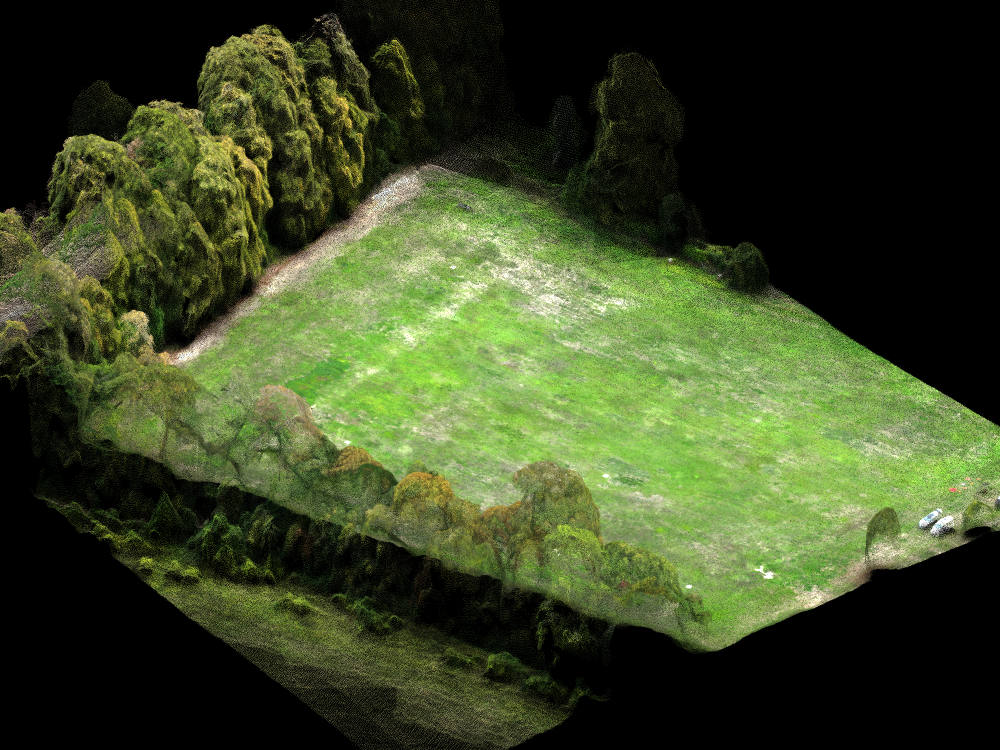
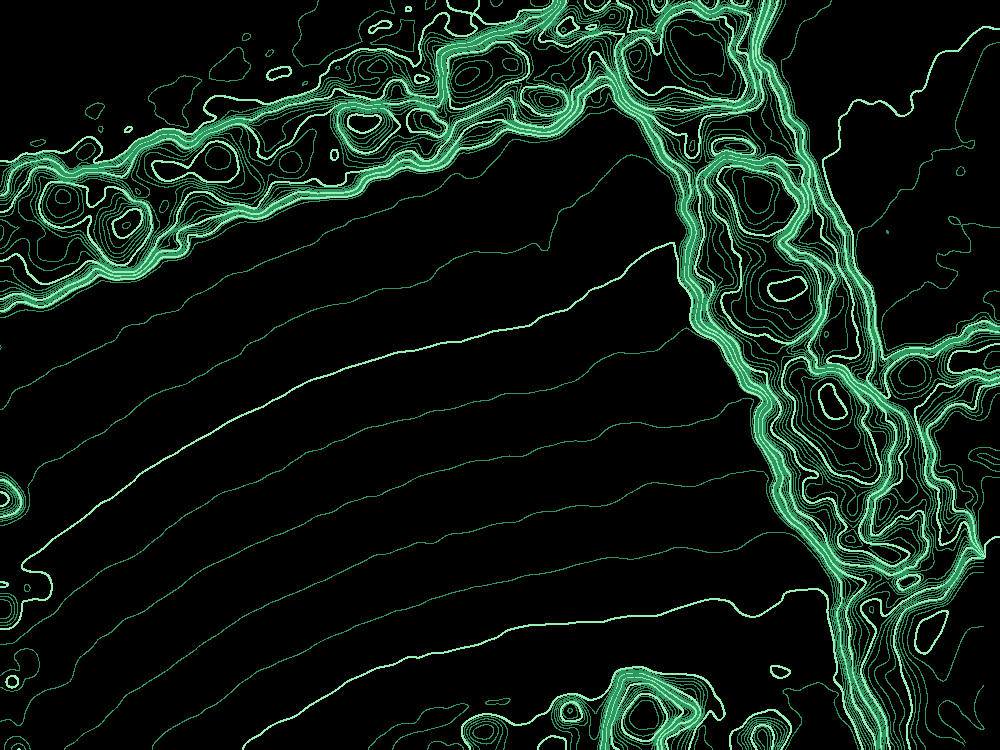
Contours at 0.5 m intervals derived from our own surveyed elevation data

DEM / DTM

ELEVATION MODEL · CONTOUR EXPORT

m³

Volumetric Report

STOCKPILE · CUT/FILL · EARTHWORKS

From our own survey flight

Real capture. Real control.

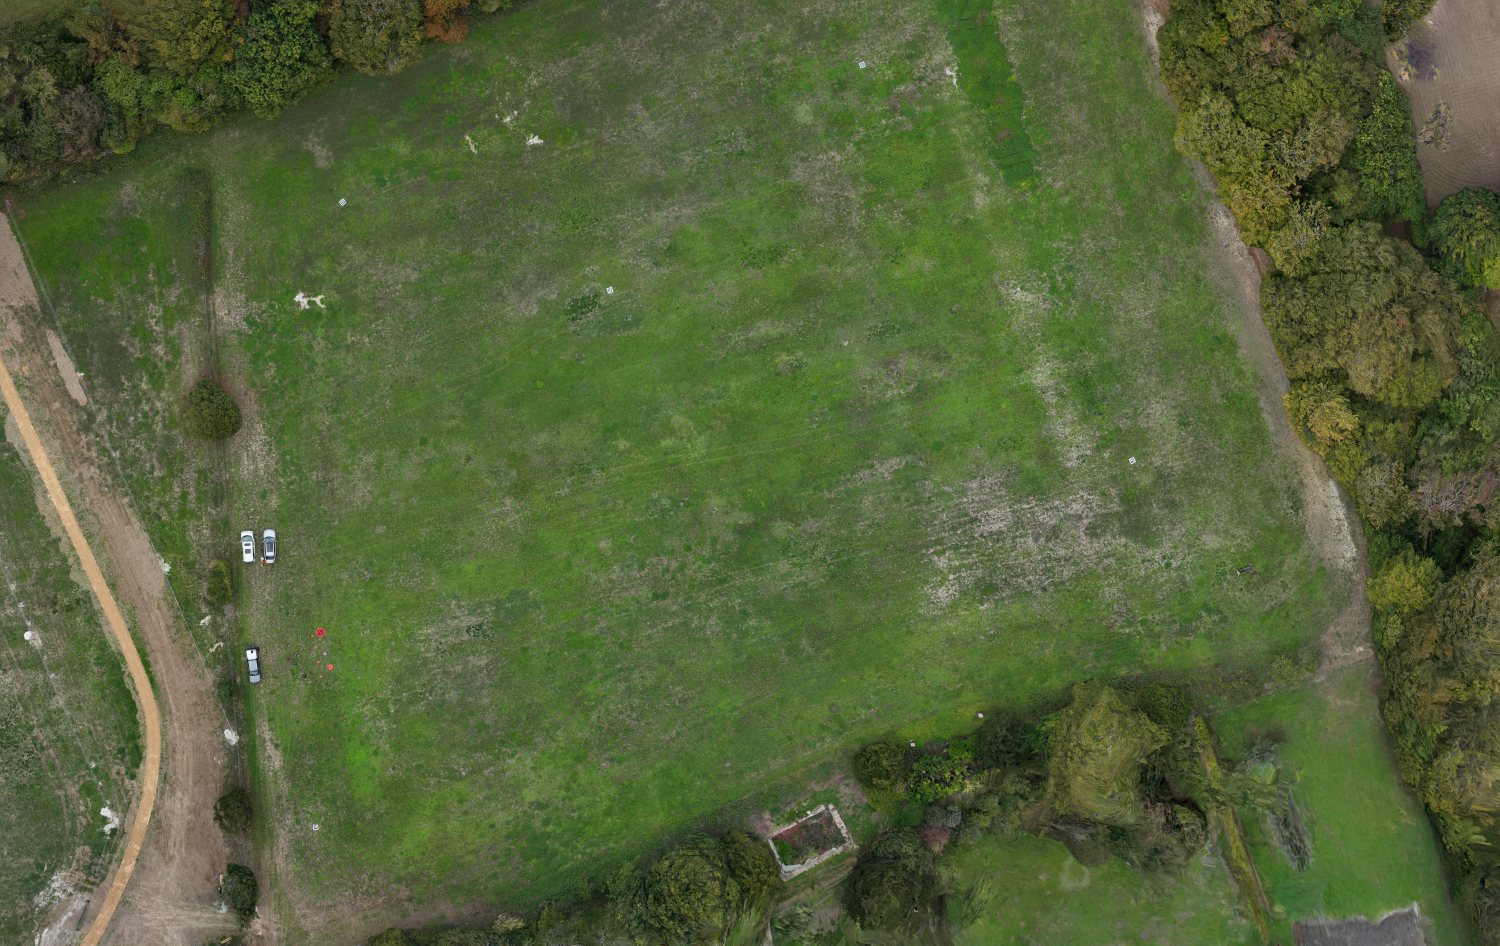
Parkland flown and processed in-house across a 6.5-hectare capture — the ground control targets are still visible in the grass.

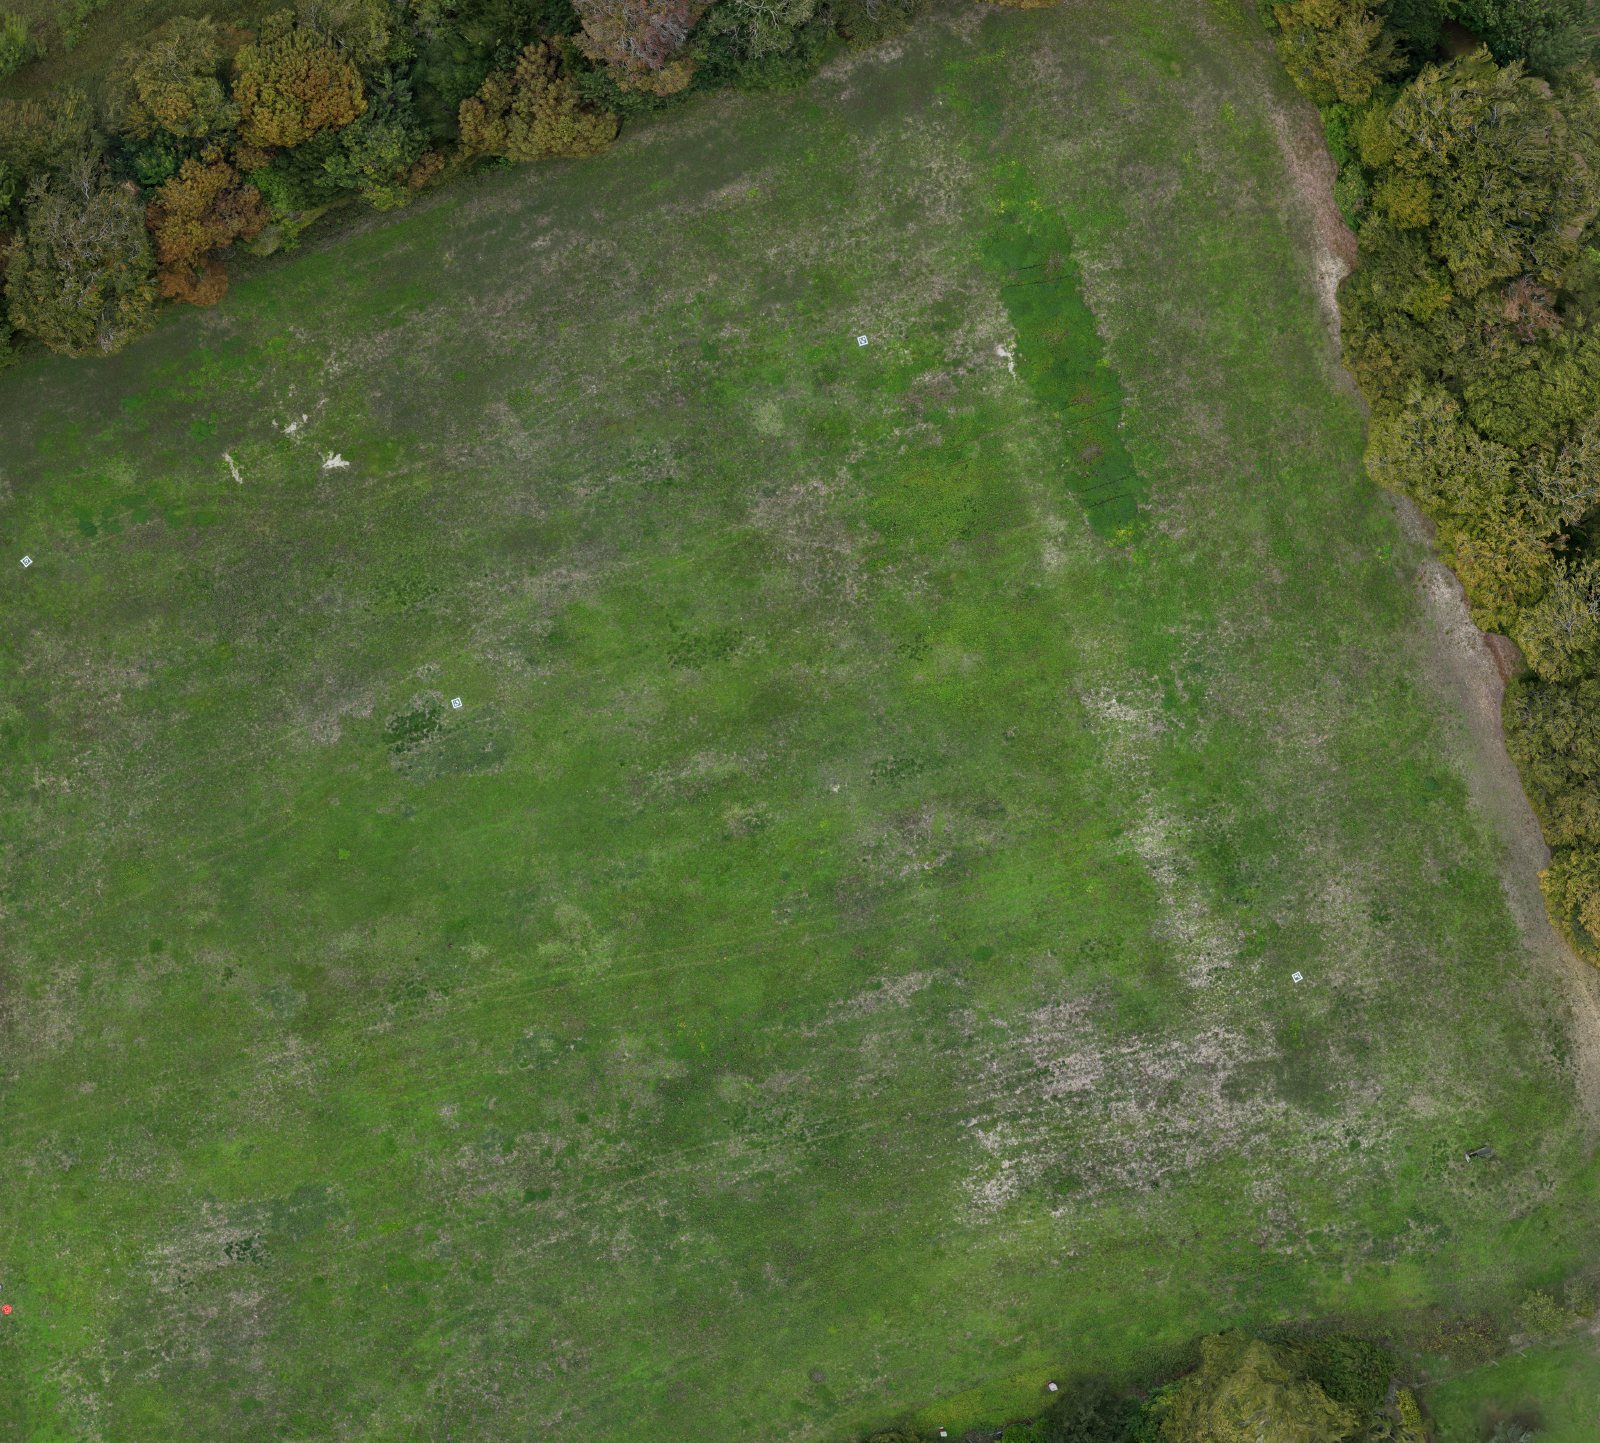
Aerial orthomosaic of surveyed parkland, with ground control targets visible as small white squares across the grass
The surveyed parkland · ground control laid across the whole extent

One flight, two outputs

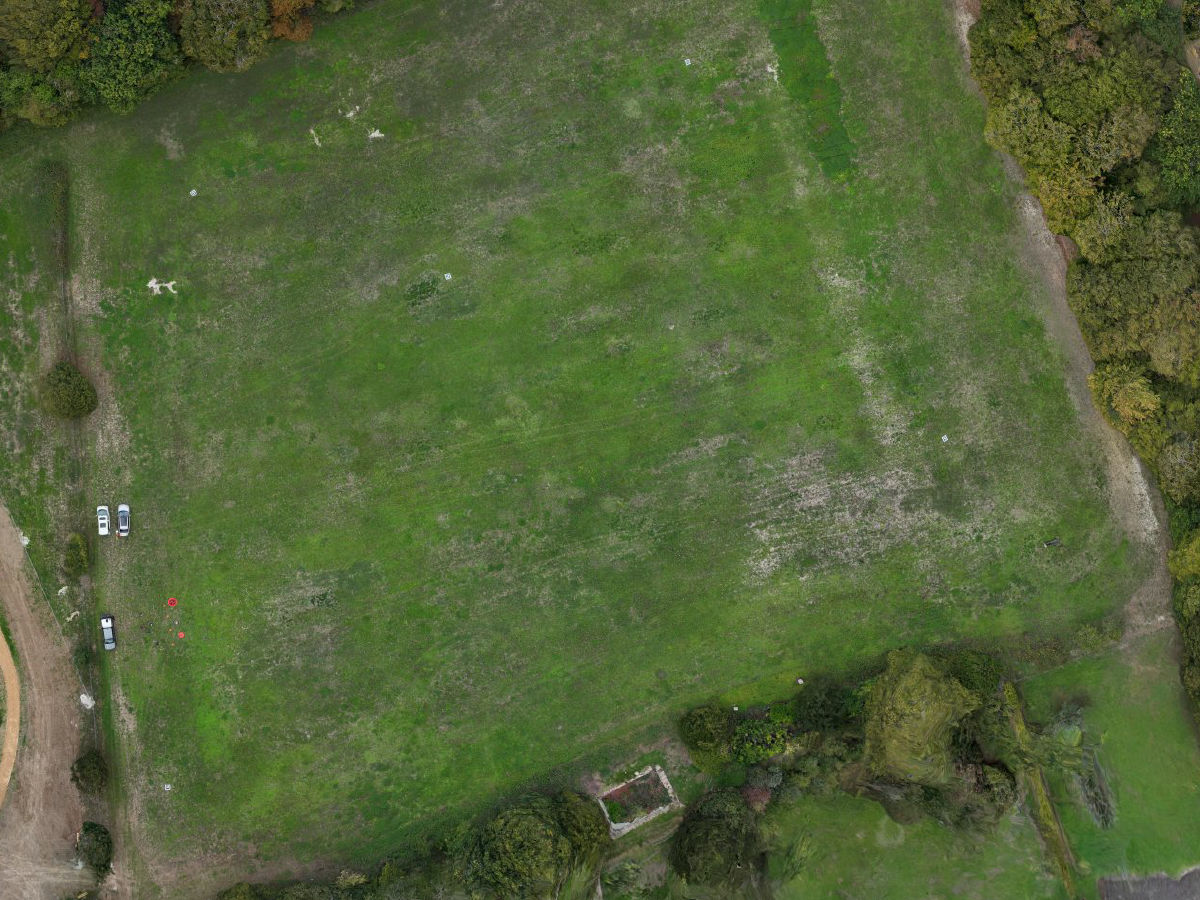
Orthomosaic of the surveyed parkland seen flat from above, ground control targets visible as small white squares
Orthomosaic · the ground as a flat, scaled map — distances and areas measured straight off it
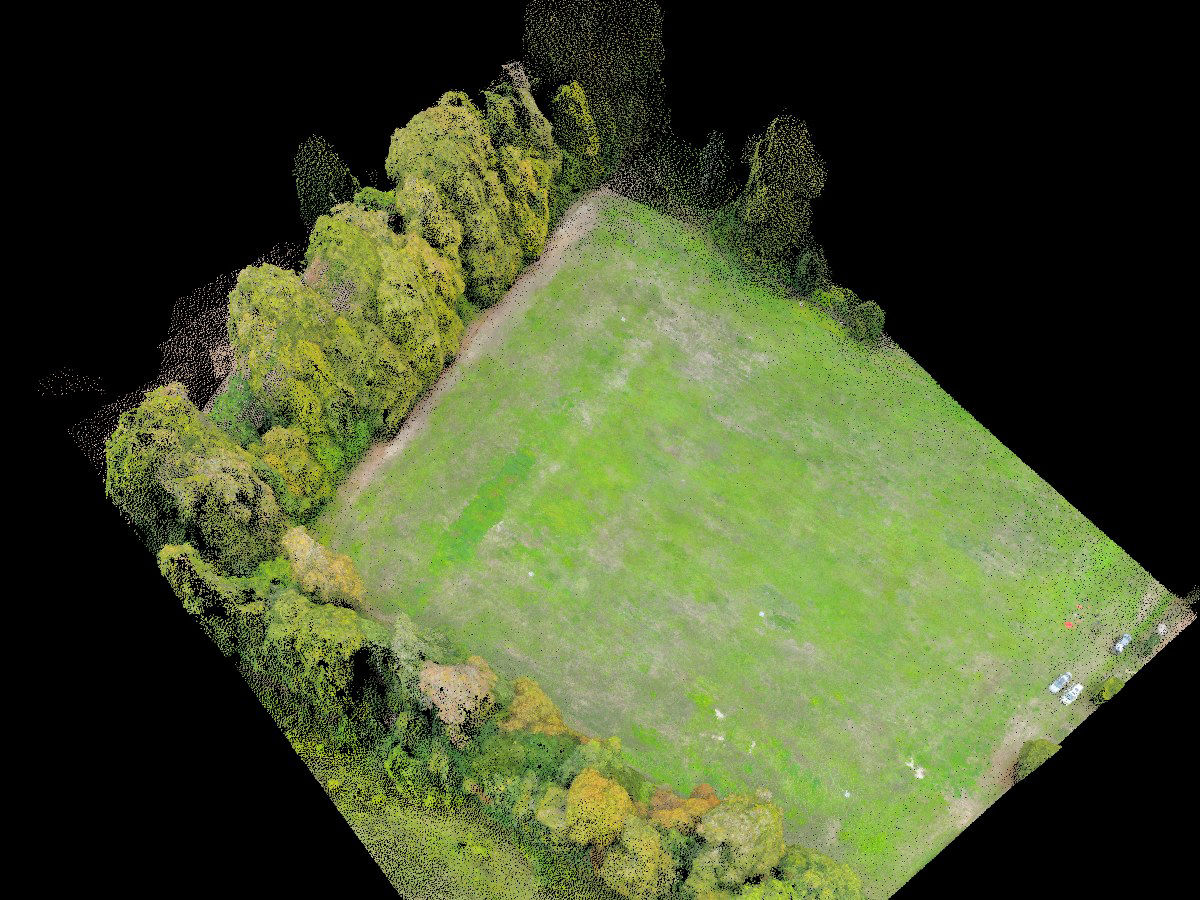
The same parkland as a point cloud, viewed at a low angle so the tree canopy stands above the measured ground surface
Point cloud · the same ground with its third dimension — levels, volumes and cross‑sections

The same 6.5 hectares, out of the same 191 images and the same ground control. Neither is an illustration. A flat map answers where and how far; the cloud answers how high, how much and how it has changed since last time — which is why the survey produces both rather than making you choose.

Detail of the orthomosaic over open parkland, with small square ground control targets laid out across the grass
Orthomosaic detail · 1.85 cm ground sample distance
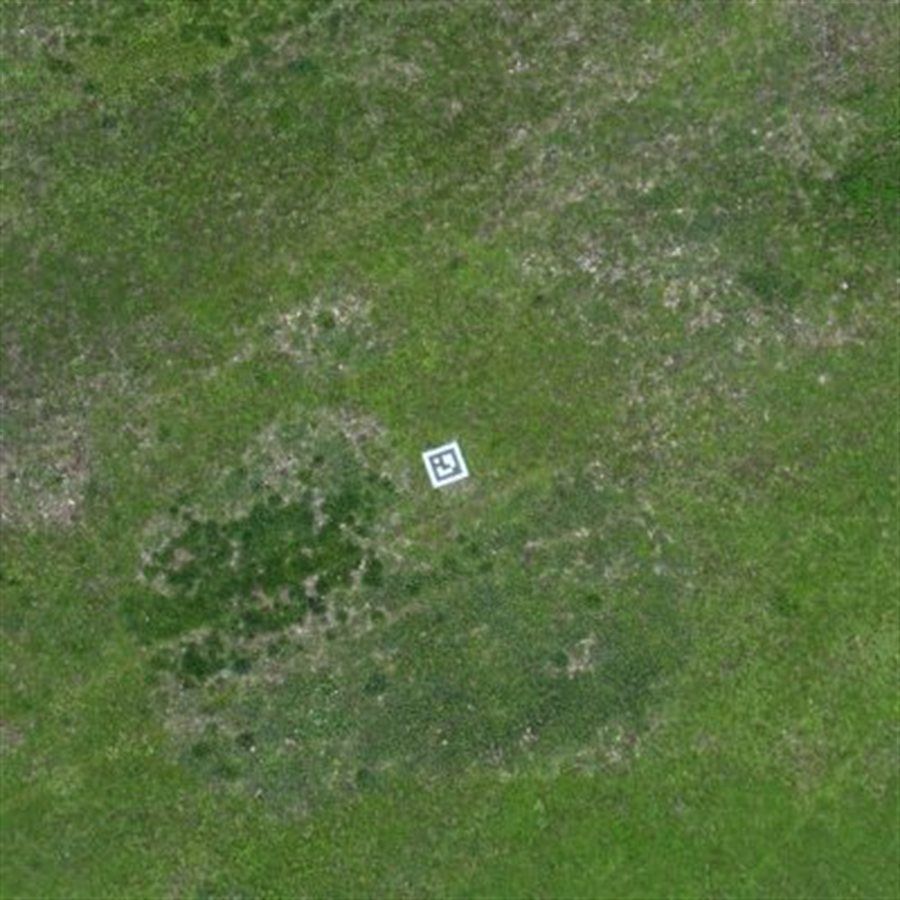
Close view of a coded ground control target on grass, as resolved in the orthomosaic
A control target, as the survey resolves it
  • Ground sample distance1.85 cm
  • Dense point cloud12.4M points
  • Images captured191
  • Area covered6.5 ha
  • Time in the air4 min 20 s
  • Ground controlEmlid RS4 RTK

Figures taken from the processing report for this flight. Project accuracy is confirmed per site — see accuracy.

Architects, planning & design

Existing conditions you can design from.

Title plans and Ordnance Survey extracts used in place of a measured survey are among the most common reasons an application fails validation — and an invalid application does not start the statutory clock.

Survey before design, not after

Being sent back for a topographic survey once an application is already in costs the redesign as well as the delay. Surveyed properly at the start, the drawing goes in with the application and the levels behind it are measured rather than assumed.

TOPO TO CAD · OSGB36 / BNG · LEVELS & CONTOURS

A site context model, not a mood board

The site and what surrounds it as a dimensionally accurate model — neighbouring ridge heights, boundary levels, tree positions and the ground your design has to sit on. Something to test a massing against, and to show a committee.

SITE CONTEXT MODEL · MESH/OBJ · MEASURED ELEVATIONS

Dimensions you can go back for

Elevations, heights, areas and distances taken off the record months later without a return visit or a ladder — and hosted for twelve months in the price, so the consultant you bring in next can open it without buying a seat.

MEASURE LATER · 12 MONTHS HOSTED · NO SEAT TO BUY

Ground control is laid and surveyed on every job, with an independent check point held back — because the first question a planning officer or a structural engineer asks about a survey is how it was controlled. More on who we work with →

Volumetric measurement

Quantities, not just pictures.

Comparing a surveyed point cloud against a design surface or an earlier survey turns geometry into a number you can act on.

MeasurementMethodExample output
Stockpile volumePoint cloud vs. ground plane1,240 m³ (illustrative)
Cut / fillDesign surface vs. as-flown surface−860 m³ cut (illustrative)
Progress over timeSurvey vs. previous survey+310 m³ this period (illustrative)

Figures above are illustrative formatting examples, not real project data.

Why drone photogrammetry

Drone survey vs. traditional survey.

Where an aerial photogrammetric survey outperforms a conventional ground survey.

FactorTraditional ground surveyLAM drone photogrammetry
Time on siteMultiple visits, often days for larger sitesSingle flight session, typically hours
CoverageDiscrete surveyed points and cross-sectionsContinuous coverage — every square metre of the site captured
Repeat monitoringA fresh visit, and cost, each time the site changesRepeat flights overlay directly for progress and volumetric change over time
EquipmentStandard survey-grade instrumentsDJI Matrice 4E with RTK & Emlid Reach RS4 base station
AccuracySurvey-grade, dependent on method & equipmentBetter than 60 mm horizontal, 44 mm RMS, measured against withheld check points — Emlid Reach RS4 ground control & RTK positioning ¹
Cost driverScales with crew time and number of site visitsScales with site size and deliverable complexity ²

Get in touch

Have a site that needs modelling?

Tell us the site size, what you need measured, and the format you work in — we'll come back with a plan and a price.

Request a Quote